Academic project · 2025–2026
RNA-seq analysis of Notch2 knockout neural stem cells
A public-data reanalysis that keeps biological replication, sample structure and the limits of differential expression in view.
Python / PyDESeq2 / R / Bash
The question
How does gene expression differ between Notch2 conditional-knockout and wild-type mouse hippocampal neural stem cells in the public GSE116773 dataset?
Respecting the experimental unit
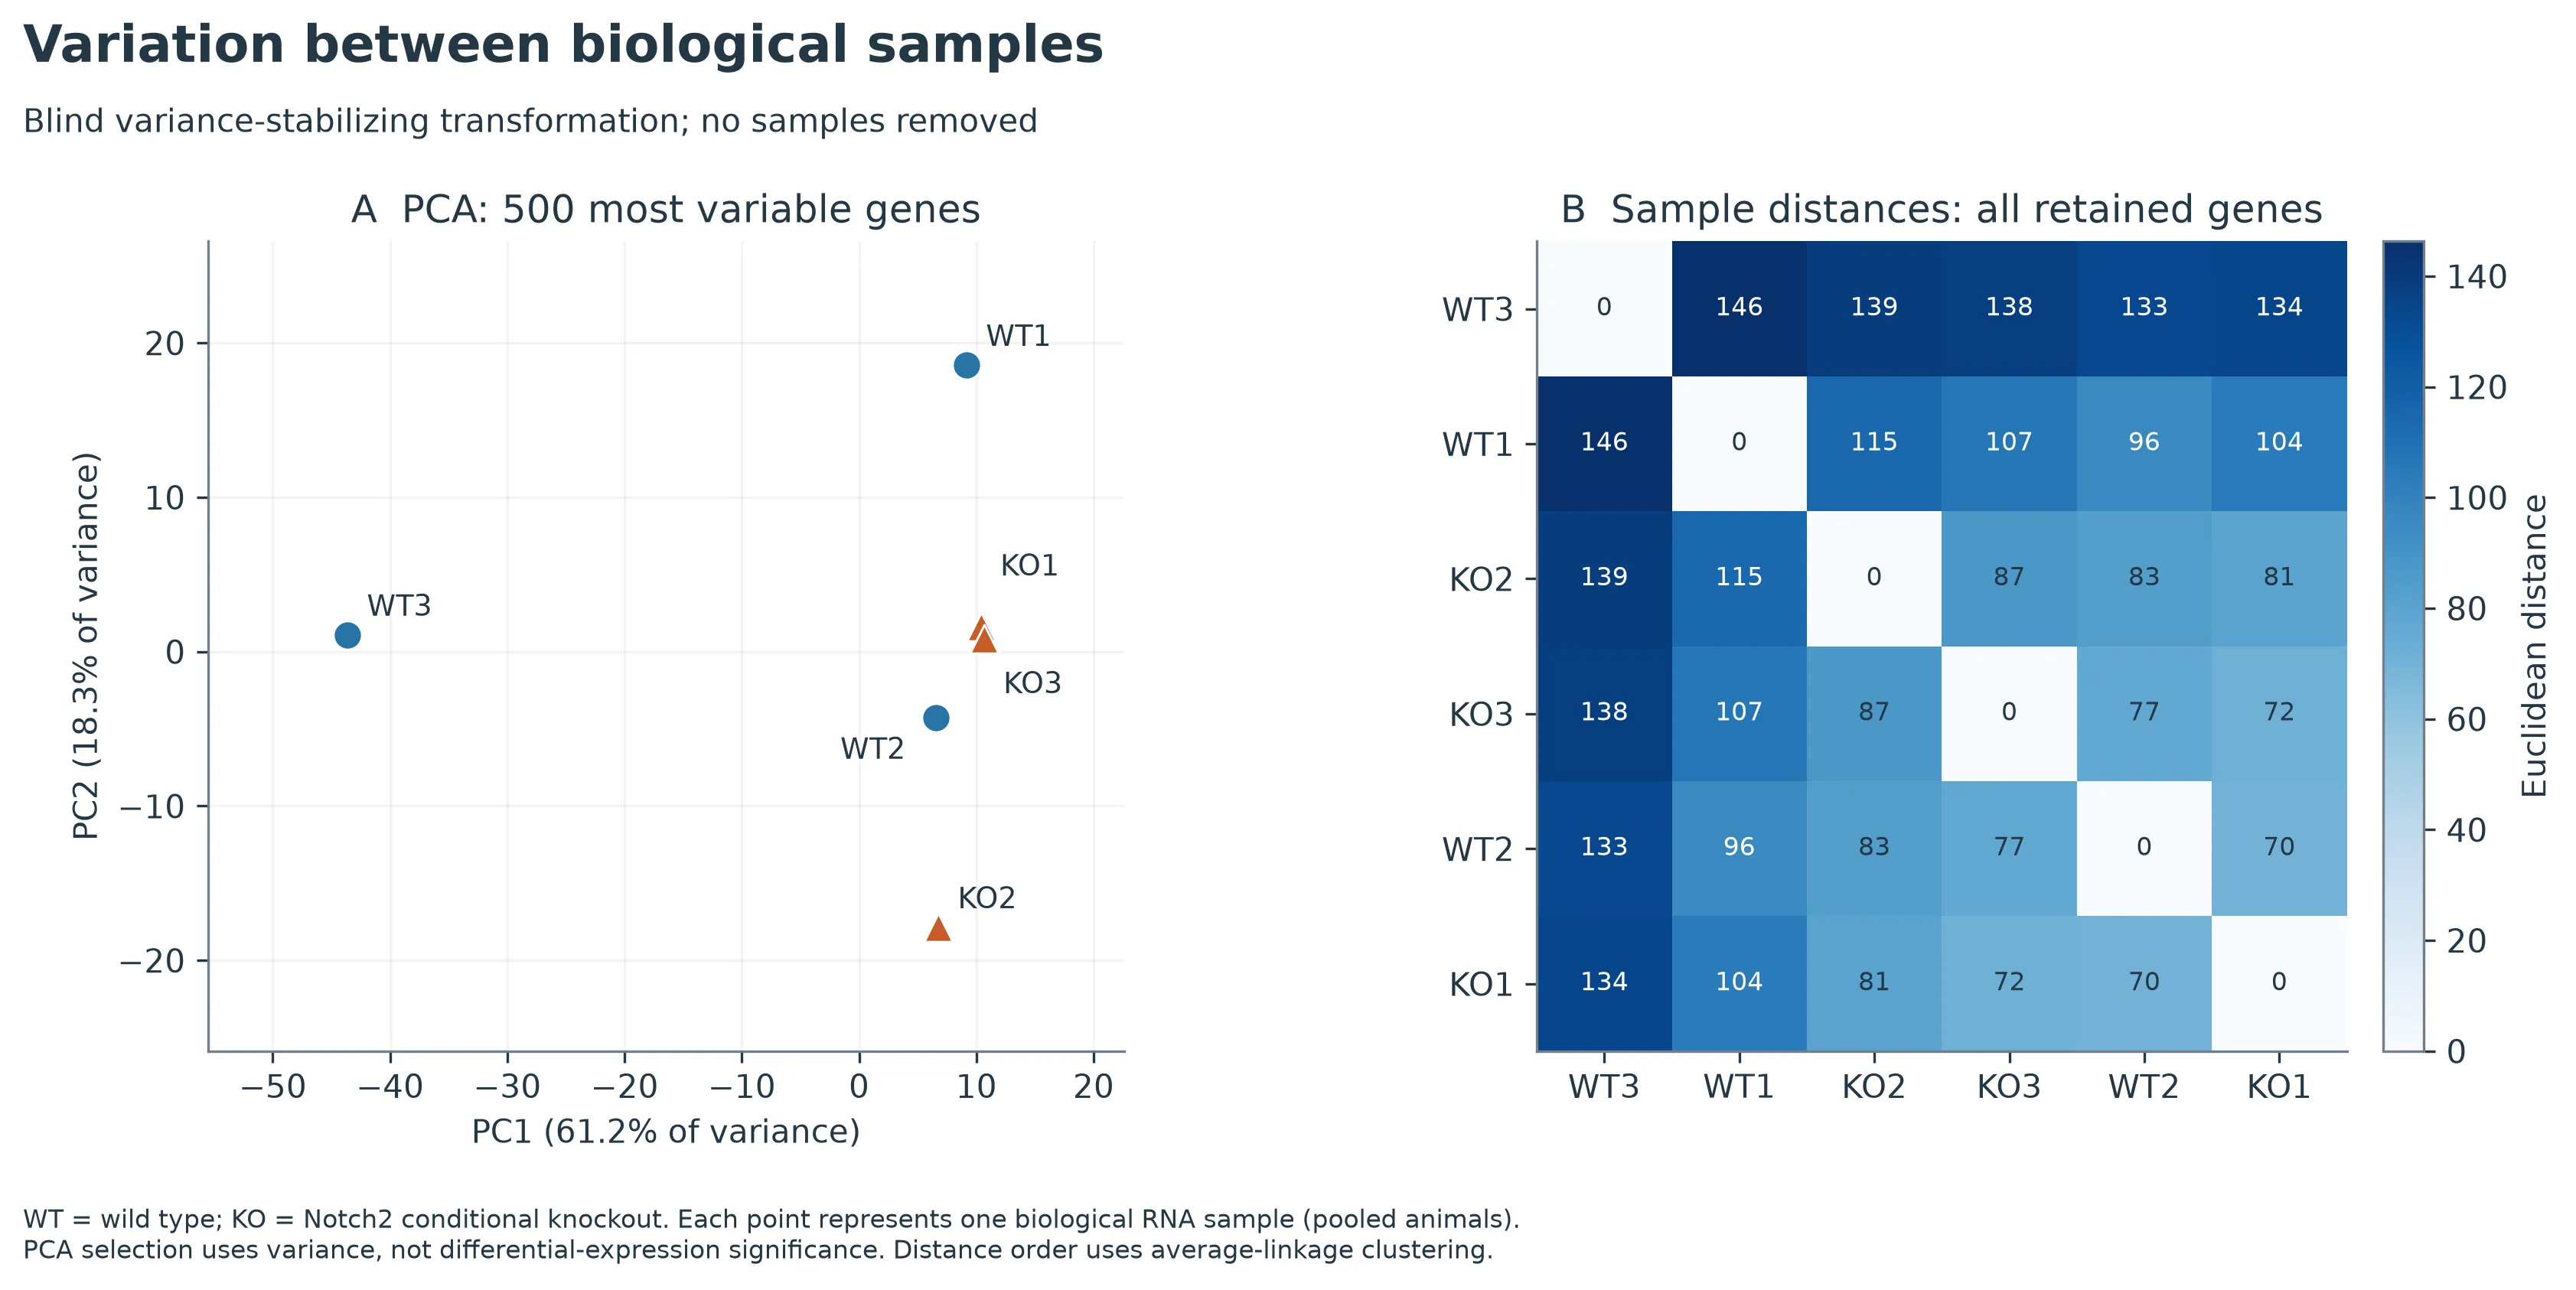
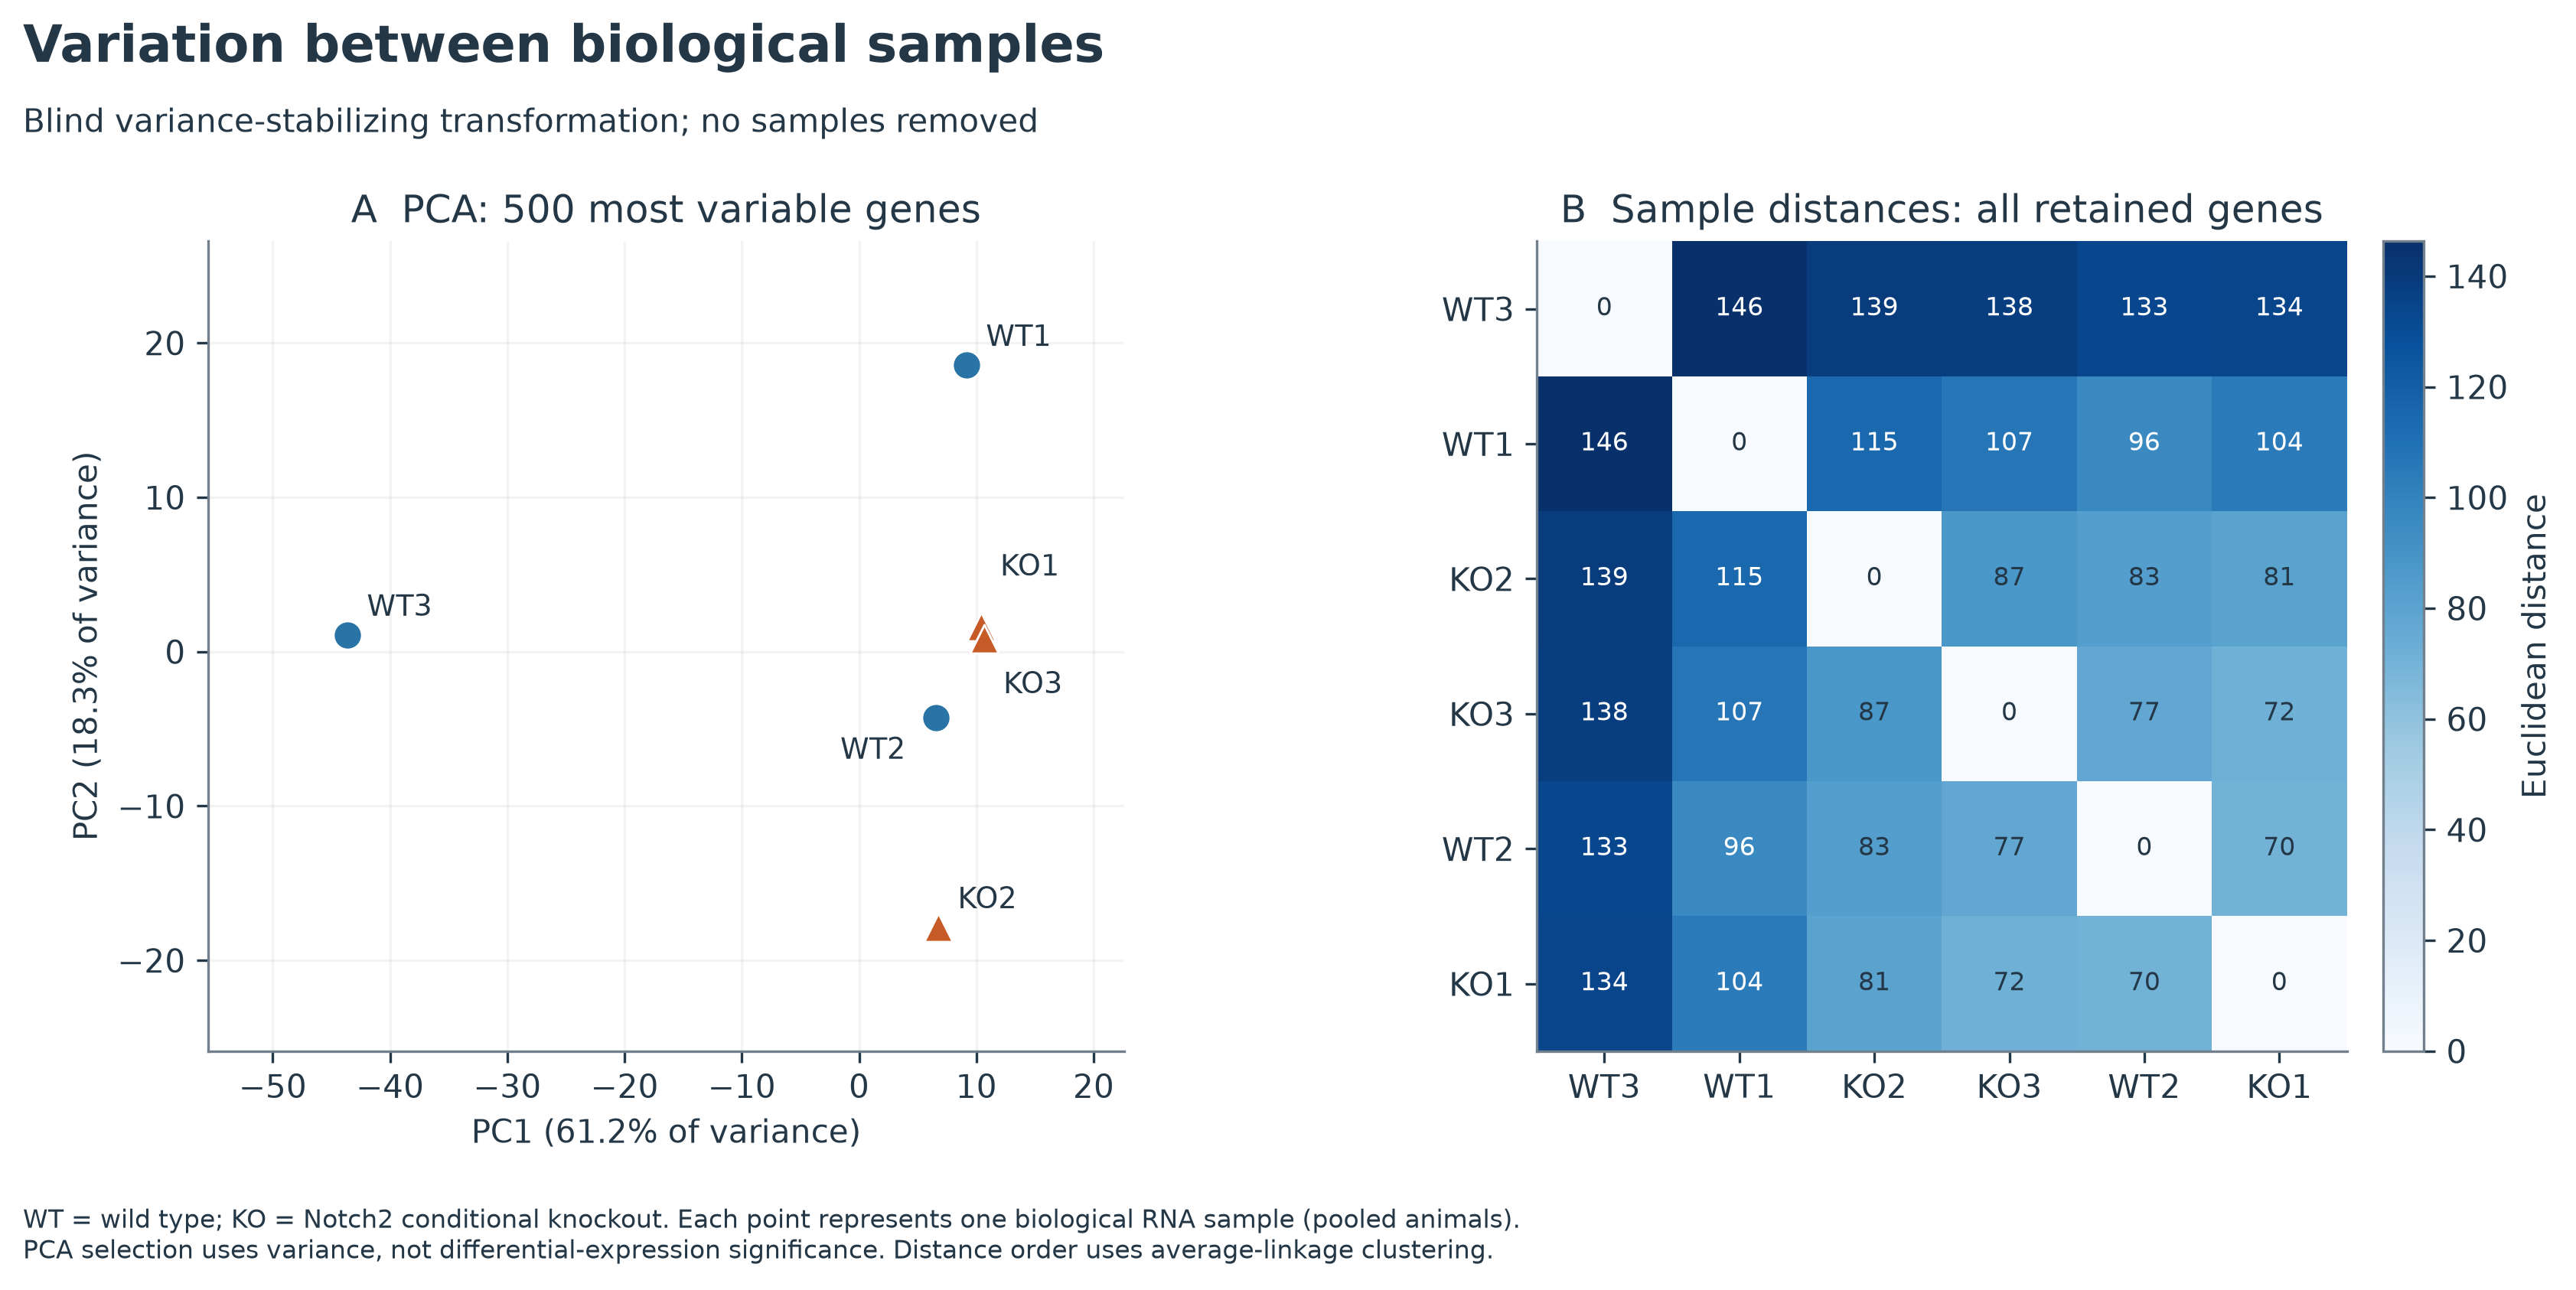
The 24 technical count files represent six biological RNA preparations, with three biological samples per condition. I combined technical files at that biological level rather than treating them as independent replicates.
Analysis
I used the study-provided GRCm38 count data, PyDESeq2, Wald tests and Benjamini–Hochberg correction. PCA, sample-distance heatmaps and expression plots helped inspect the structure of the data.
Among 21,531 retained genes, 121 met an adjusted p-value threshold of 0.05: 77 had higher and 44 lower expression in knockout samples. None of eight predefined candidate genes, including Id4, passed that threshold.
Interpretation and limits
WT3 differed noticeably from the other samples. With three biological replicates per condition, that structure matters when interpreting the differential expression results.
The repository also contains GRCm39 read-processing scripts, but their original count matrix is unavailable. The reported results use the GRCm38 count data. Neither statistical significance nor the observed expression change by itself establishes direct Notch2 regulation.